Product & Customers Analysis
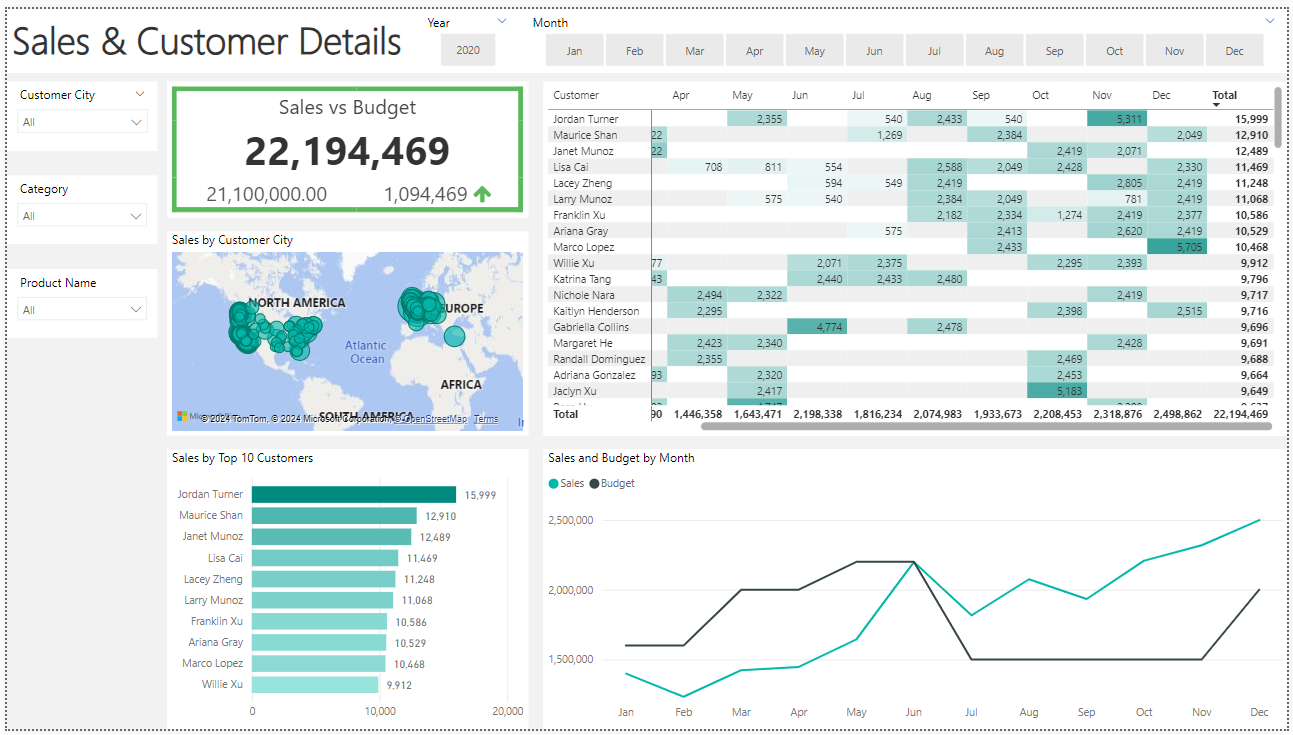
It was important to be able to visualise trends for a business. Two Dashboards were created, the first one shows the most important KPI’s, focusing on total sales, margins. and customer information.
The second Dashboard focuses more on products, best sellers and purchase history.
Goal
Help sales managers analyse top-selling for inventory decisions.
Help visualise customer locations to support marketing decisions.
Steps
Use SQL to automate data extraction from source.
Structured dimension tables and fact tables to enable analysis of sales.
Create two reports showing the most important KPI’s.
Result
Automated the data collection process, simplifying future analysis.
Consolidated KPIs into one Dashboard with location and customer filters for analytical and business decisions purposes.

To create the necessary data model and fulfilling the business needs defined in the user stories the following tables were extracted using SQL.

Simplifying the Date table with only the required columns.
Focusing on the year 2020.
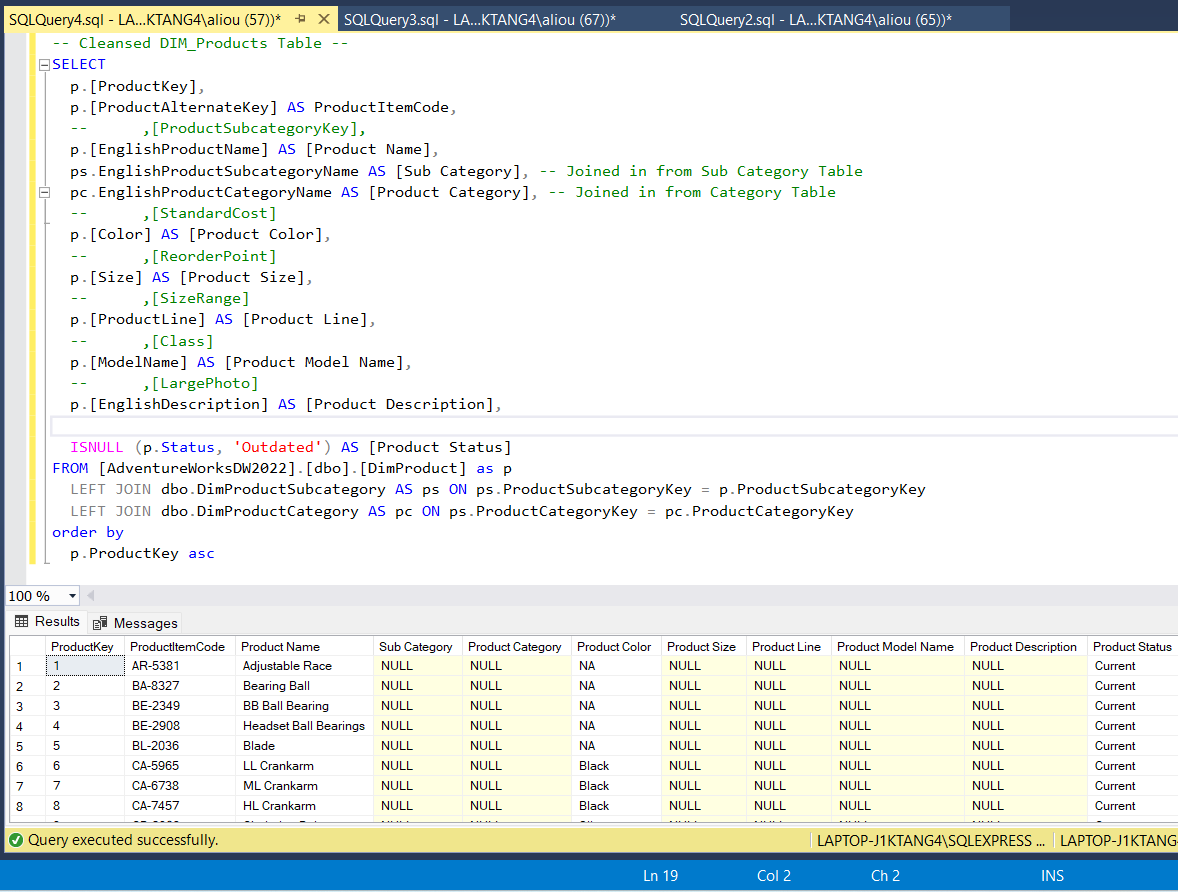
Joining the product table with the category and subcategory DIM table.
Handling NULL values.
Fetching 2020 data


Cleaned the customer DIM table.
Performed a LEFT join with the geography table.

Data Model showing how FACT_Budget connects to FACT_InternetSales and the other necessary DIM tables.