Restaurant Sales Analysis
A restaurant needs help finding out their best and worst sellers to decide which item to remove from the menu to reduce their weekly ingredients cost.
They also want to find out which days are most profitable and busy to organise their staff and opening hours.
Goal
Facilitating strategic adjustments to employee scheduling based on daily and weekly sales trends.
Streamline the visualization of key performance indicators, including revenue and average order value.
Identify top-selling products to inform inventory decisions.
Steps
Connect Data from SQL server to Excel worksheet to automate data extraction.
Use pivot table and filters to allow ease of view of KPIs.
Developed an Excel dashboard to provide data visualization.
Pivot tables and KPIs


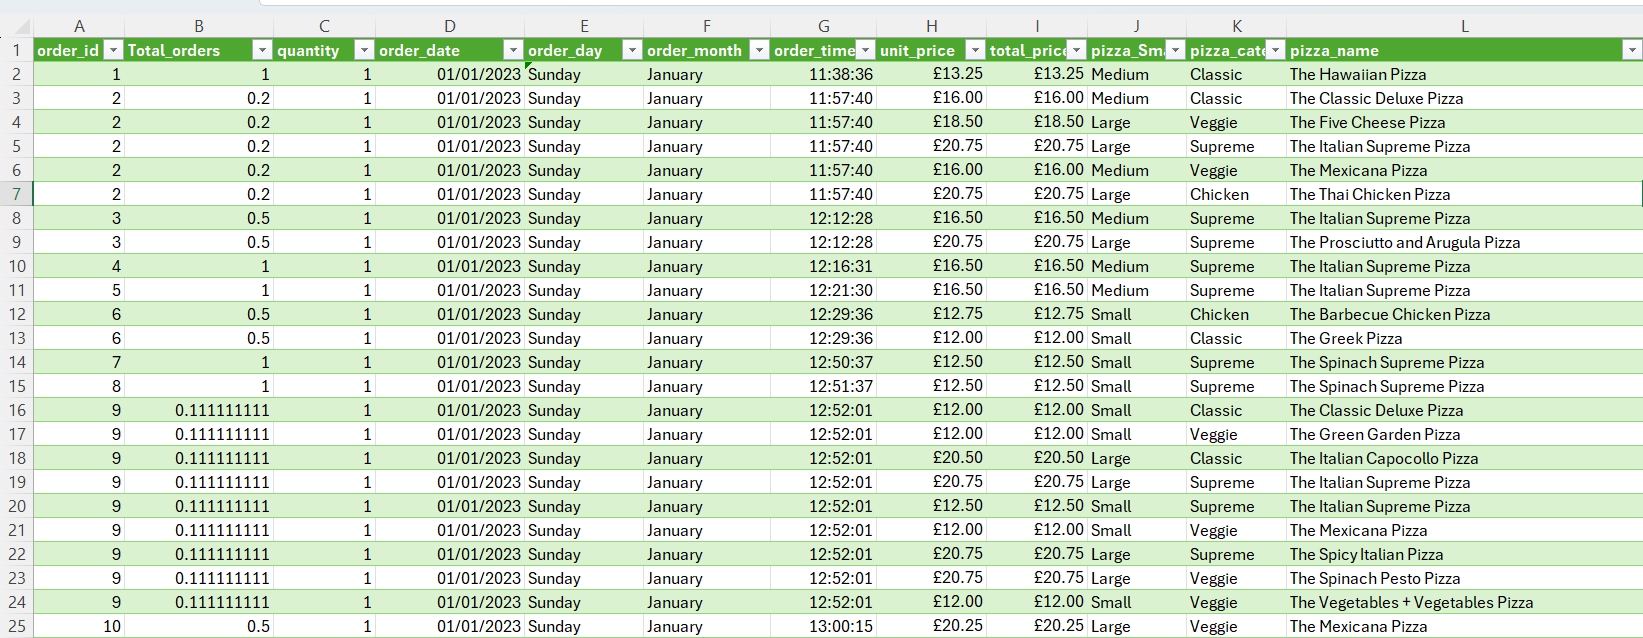
Cleansed Sales Excel Data Sheet
Result
Automated the data collection process, simplifying future analysis.
Consolidated KPIs into one Dashboard for analytical and business decisions purposes.